Trump's Tariffs, visualized
How many insights can data visualization provide us about the economic rationale (or lack thereof) of Trump's "reciprocal" tariff regime? Quite a few, it turns out.

Note: Throughout this post, and in the visualization analysis, I often refer to “countries,” though the Trump Administration’s tariffs differentiate beyond the level of a state into territories and so-forth. Please forgive this inconsistency.
Motivation
Inspired by CFR Fellow Brad Setser’s comments on Bloomberg’s Odd Lots podcast — where he mentioned that the Trump Administration’s focus on bilateral trade deficits is misguided in determining anti-competitive trade practices — I sought to prove this often-repeated economic principle with a simple, yet impactful, visualization of the data.
Background
First, some quick background in case you’re unfamiliar. On April 2nd, 2025, U.S. President Donald Trump announced his plans for “reciprocal tariffs” on all countries, with a baseline rate of 10 percent. The administration calculated additional tariffs for countries which the U.S. runs a trade deficit with by dividing the size of that deficit over the value of U.S. imports from the country, then halving the resulting percentage.
Let’s take the small island nation of Mauritius as an example. Mauritius in 2024 exported a total of 234.5 million dollars worth of goods to the U.S., only importing back 48 million dollars. This left the U.S. with a trade deficit of 186.5 million dollars.
Calculating the reciprocal tariff rate,
The actual tariff rate applied to Mauritius, prior to the April 9th 90-day pause, was 40%.
In his announcement of the tariffs on April 2nd, Trump described the tariffs as reciprocal, responding to foreign “tariffs charged to the U.S.A… including currency manipulation and trade barriers,” though the calculation of the tariff, as described above, is remarkably simple and is solely based on the size of the U.S’s deficit relative to the value of imported goods.

The Visualization
To understand more about the downfalls of this method of tariff calculation — and to uncover patterns in both its causes and effects — I plot the total trade balance of a country alongside their trade balance with the U.S. Finally, I plot the tariff rate that Trump has imposed on each country on a secondary y-axis (with a visual distinction based on whether the country was mentioned in the National Trade Estimate, a report by the Trump Administration in March 2025 listing current trade barriers by country or association of countries).
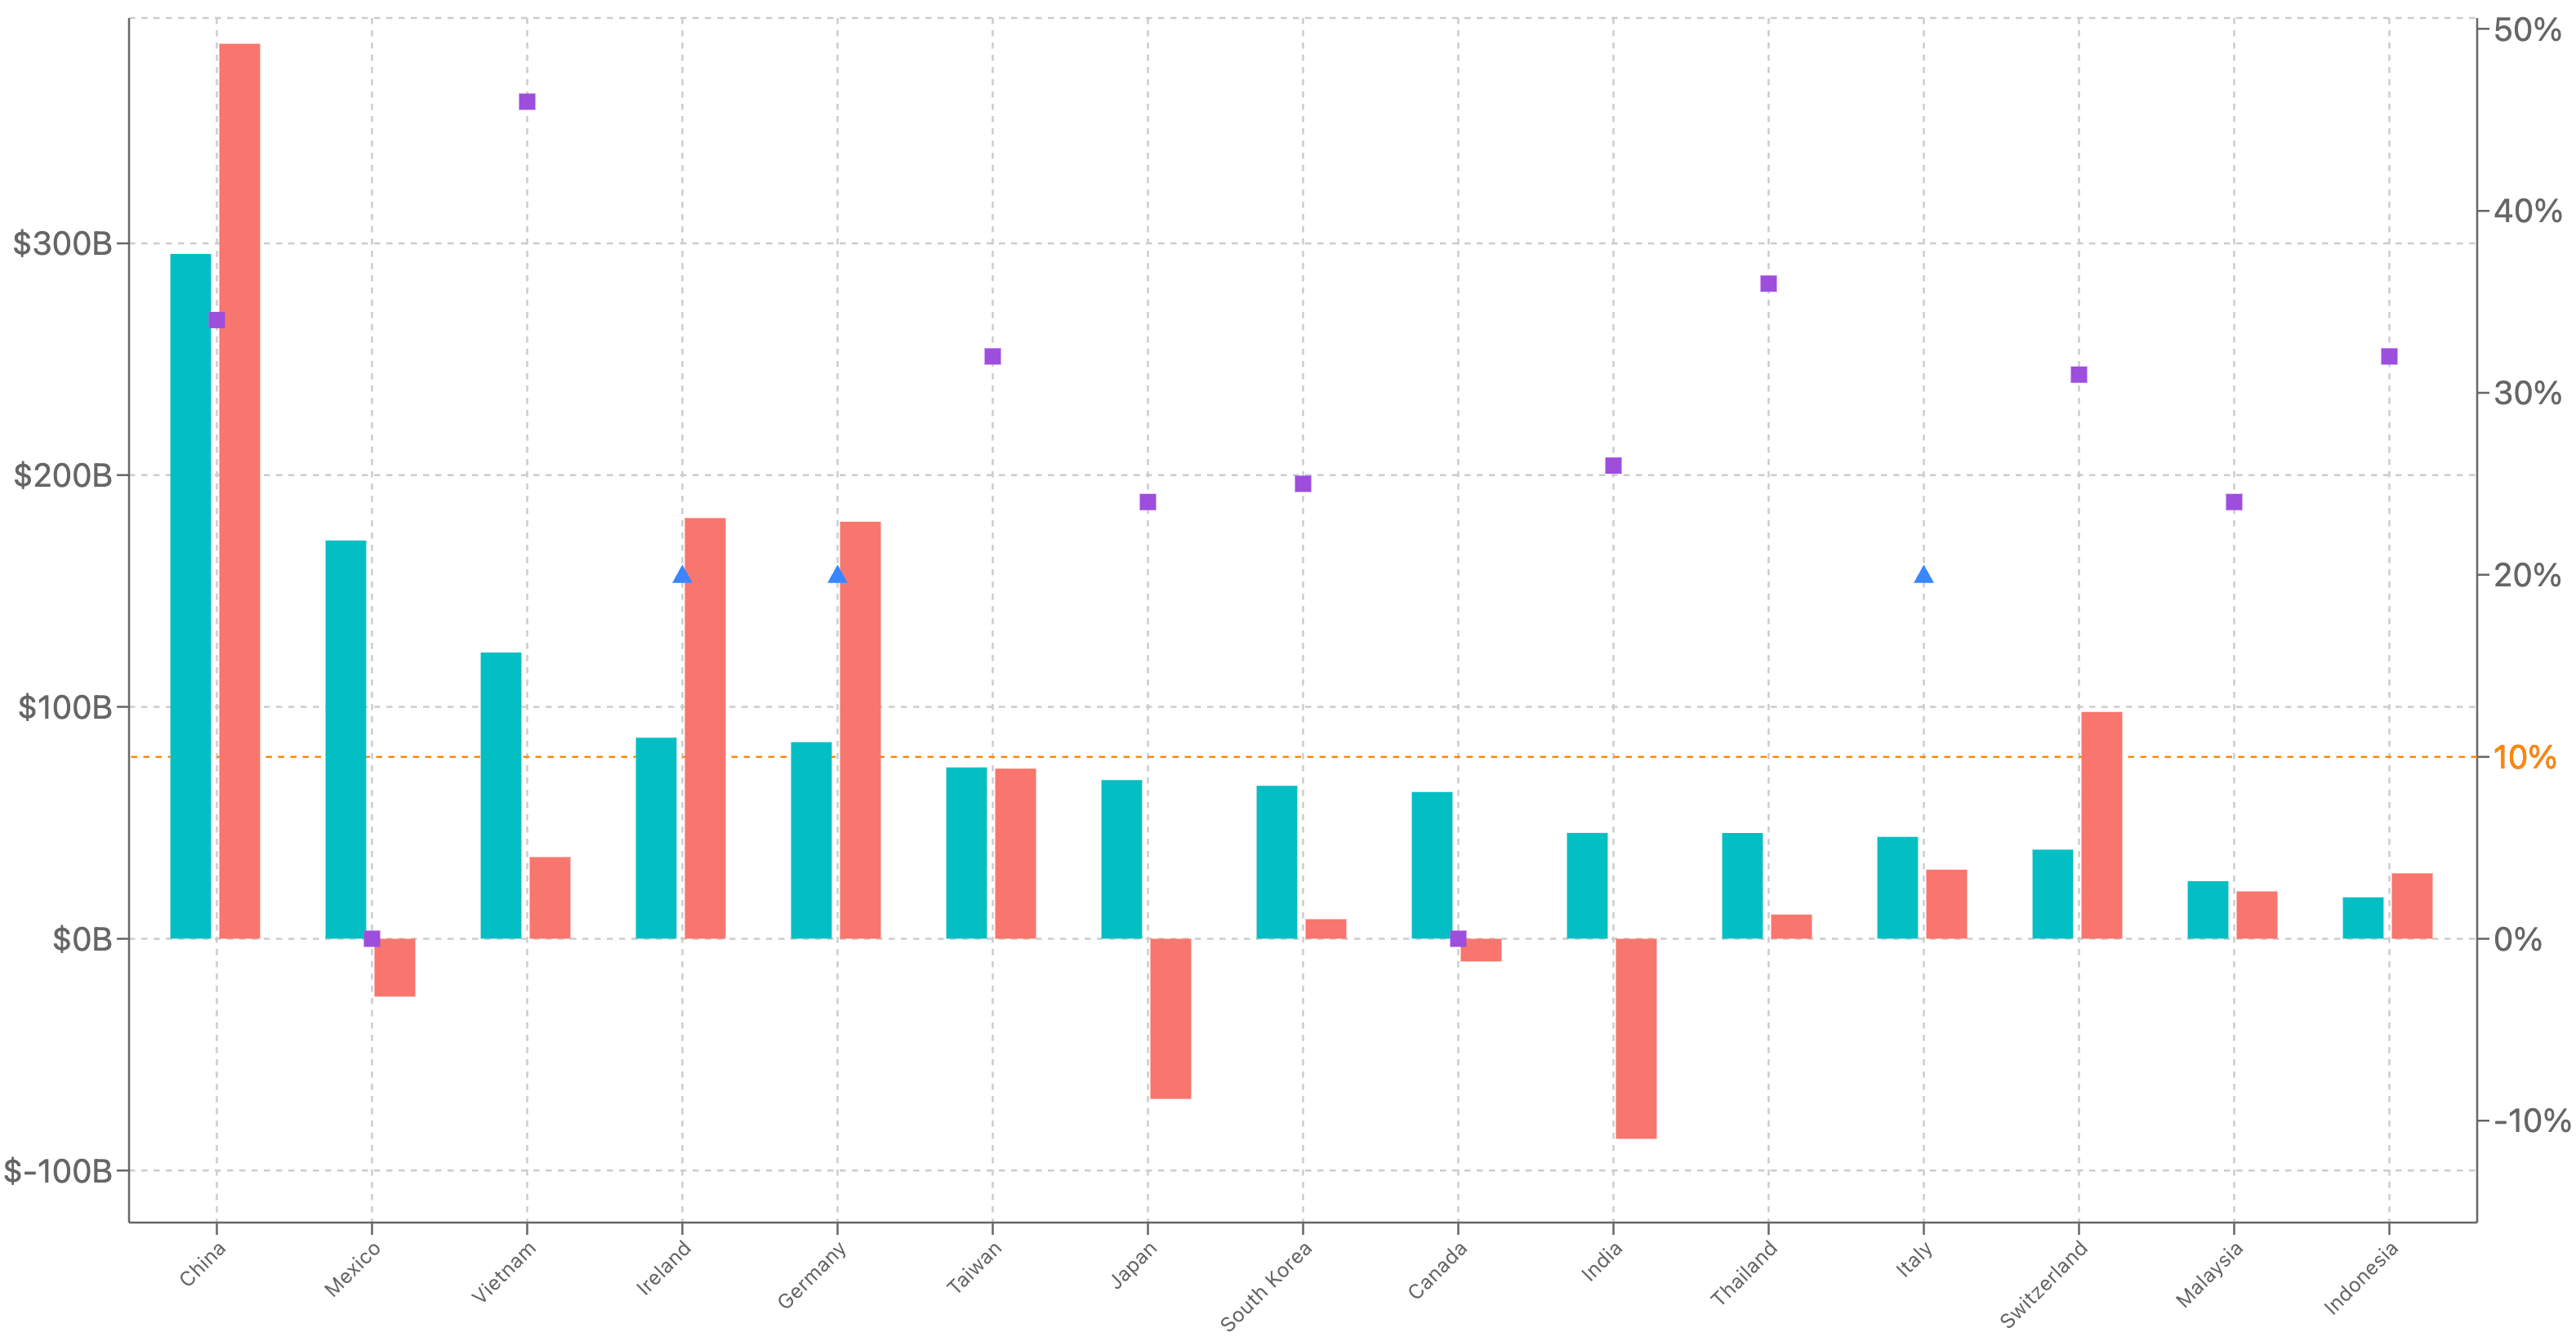
The graph, sorted in order of largest bilateral trade surplus with the U.S. to smallest, has three key components.
The red bar represents the total global trade balance of that given country (i.e. value of goods exported minus value of goods imported), in USD
The blue bar represents the bilateral trade balance with the U.S., also in USD
The purple squares, blue rectangles, and black dots (not pictured here) represent the tariffs assigned to these countries under the Trump Administration’s reciprocal tariff plan.
A purple squares means a specific section of the NTE was dedicated to this country; a blue triangle means that this country belongs to a group, like the European Union or Arab League, that had a specific section in the report; the black dot means this country did not have a section in the report
As shown above, China holds the largest bilateral trade surplus with the U.S. — at slightly less than 300 billion dollars. After China, there is a significant drop off, with Mexico and Vietnam holding slightly more than 150 billion and 100 billion dollars surpluses respectively.
Two things stand out immediately:
China is the major problem. Assuming a U.S. trade deficit of around 1.2 trillion USD, China accounts for nearly 25 percent of the entire deficit.
Most of the country’s with major U.S. surpluses are American allies. Mexico, Germany, Taiwan, Japan, Canada, and Ireland all crack the top ten. This makes sense given the assumption that trade between allies is easier and therefore more common.
These observations come at no surprise to most whom are familiar with global trade interactions and the components of the U.S. deficit. Playing around with the filters and sorting mechanisms, though, has yielded me with three key insights.
#1 — Bilateral trade deficits, even according to the Trump Administration's own trade report, do not inherently signal anti-competitive behavior
The Trump administration's tariffs are intended to be reciprocal (i.e. if country X has imposed a tariff on U.S. goods, the U.S. will impose a tariff on country X's goods). While this sounds reasonable in theory, the Trump administration operationalized it with one key assumption: the size of the U.S.'s trade deficit with any country is indicative of the extent to which that country has engaged in anti-competitive trade practices, such as currency manipulation, dumping, or quotas on U.S. goods.
Economists have long argued that bilateral trade balances provide little useful information in determining the fairness of a trade relationship. This is because trade relationships are complicated and are influenced by many factors, including both country's stages in economic development, the value of their currencies, as well as their respective consumption and savings patterns.
In fact, Setser explained that smaller economies, particularly those in Asia, often run overall current account deficits but still have trade surpluses with the U.S. This is because they export commodities and low-value add manufactured goods, like clothing, that the U.S. consumers demand — but are unable to afford U.S. exports themselves.
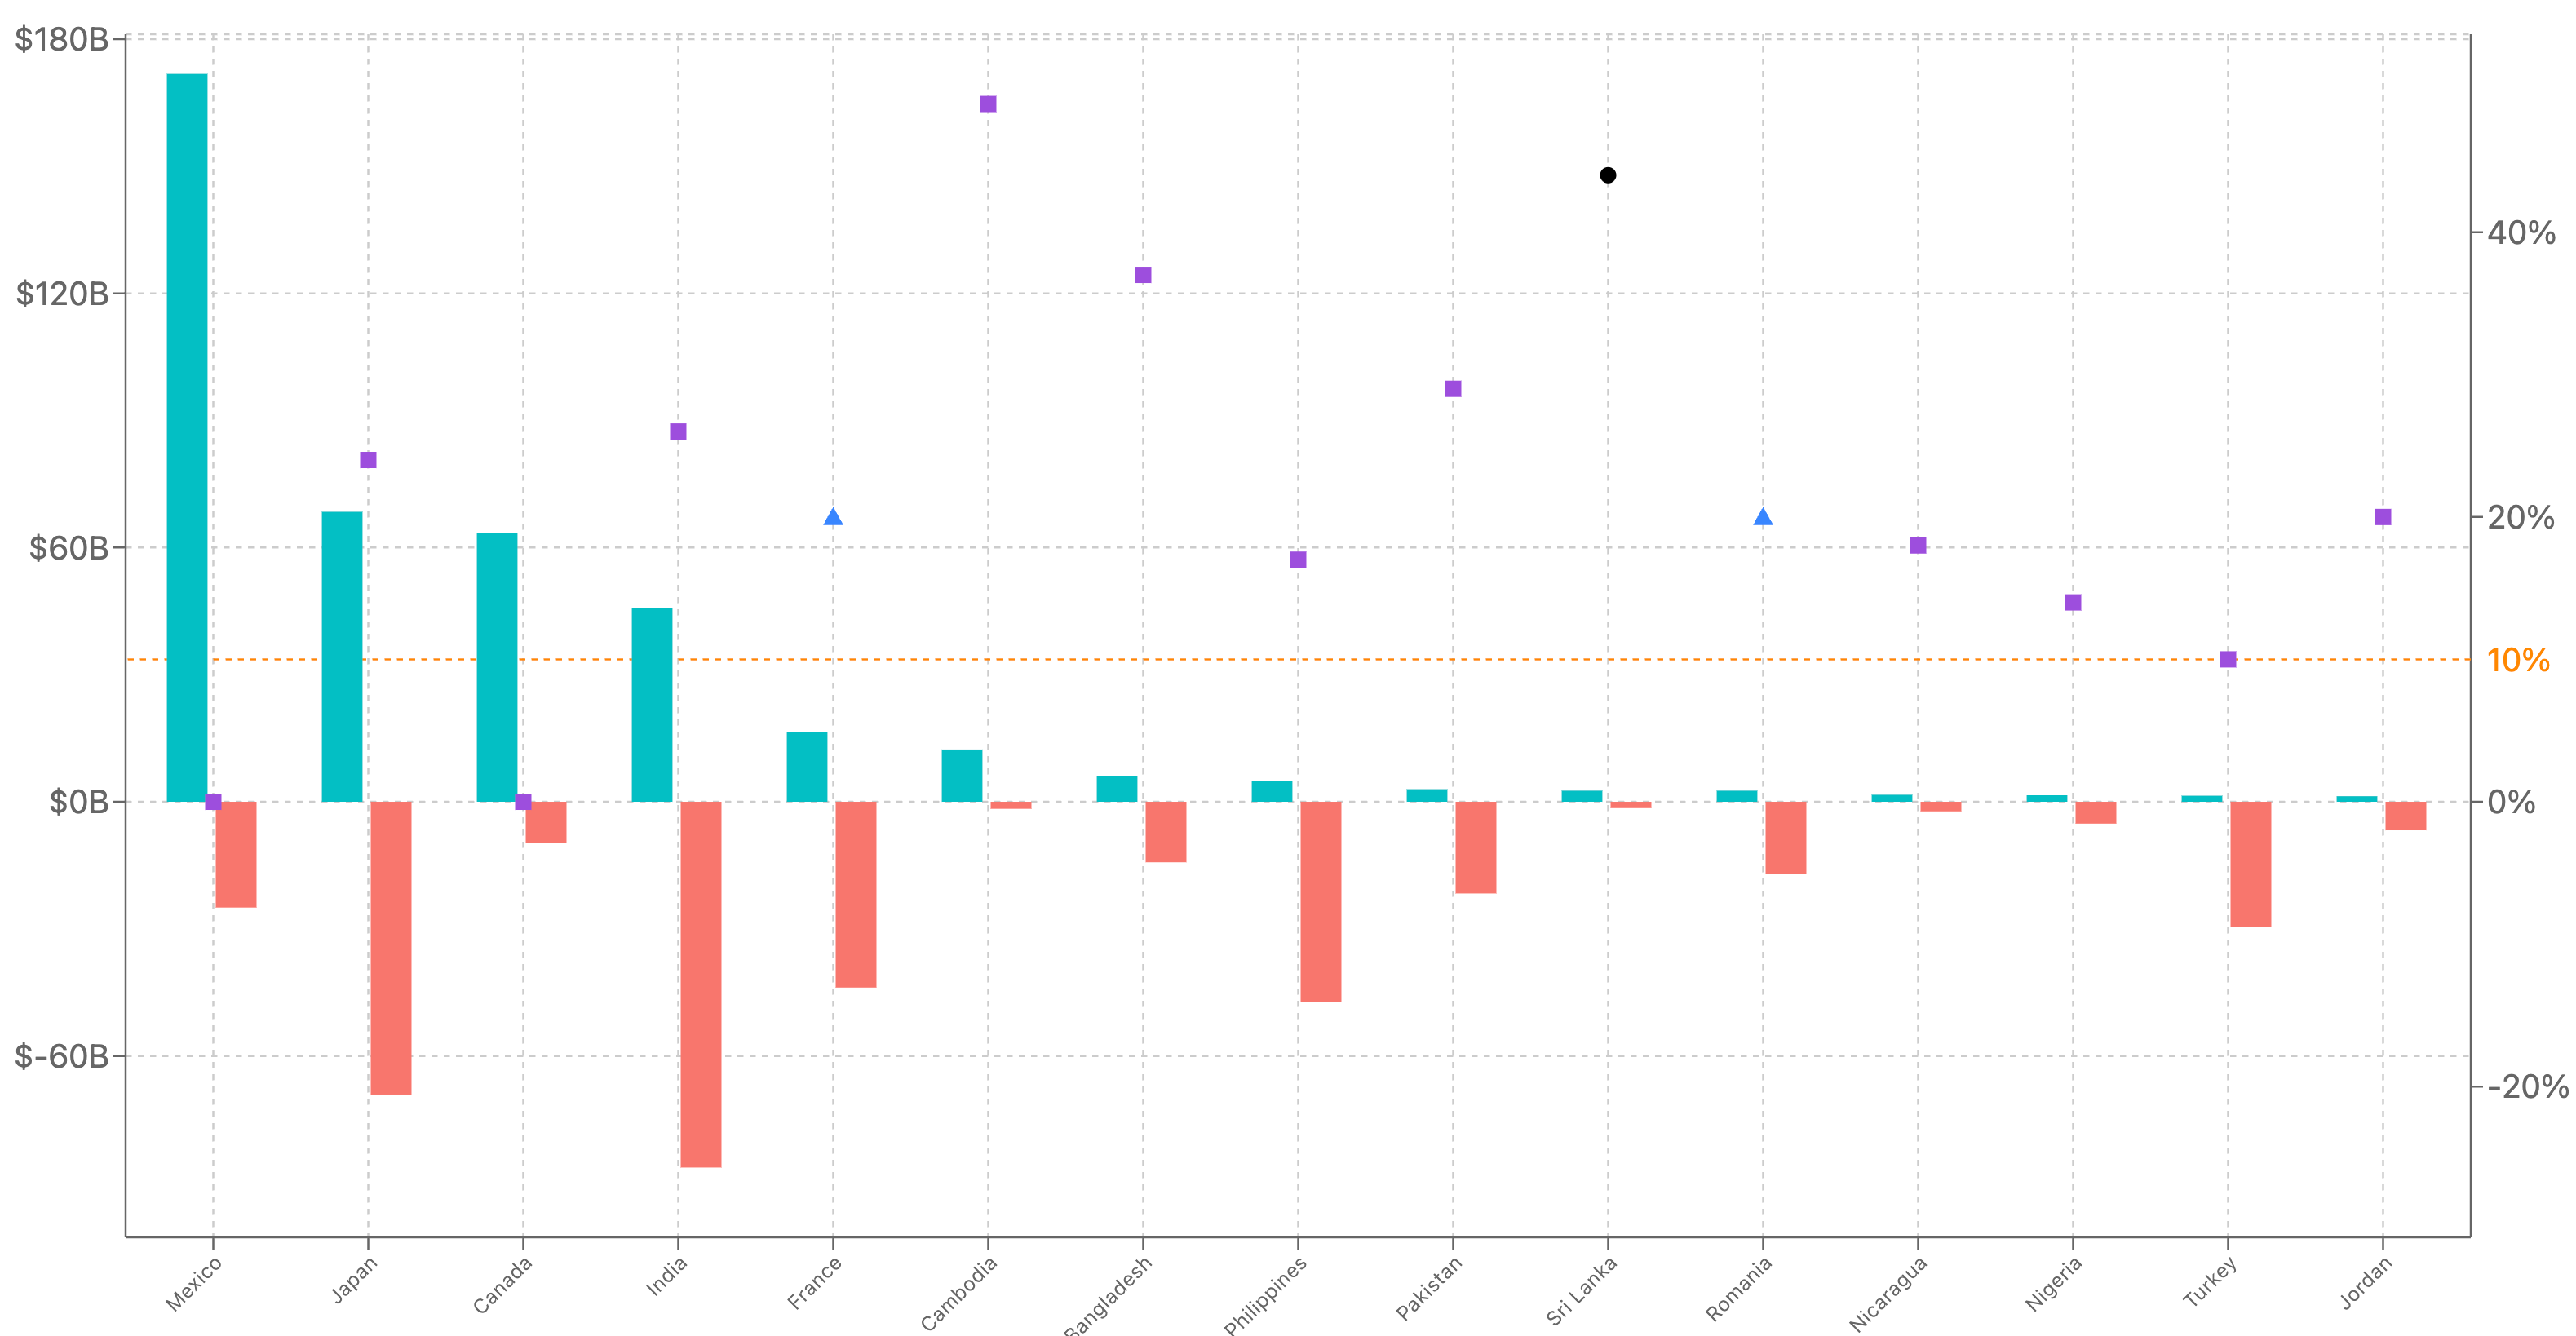
Of the 96 countries that run trade surpluses with the U.S., exactly half have corresponding trade deficits with the rest of the world — including countries like Sri Lanka, the Philippines, Bangladesh, and Mauritius. Moldova even runs a global trade deficit 50 times larger than that of its surplus with the U.S., was never mentioned in the NTE report (which lists countries with anti-competitive trade behavior), and was still given a 31 percent "reciprocal" tariff. See below:
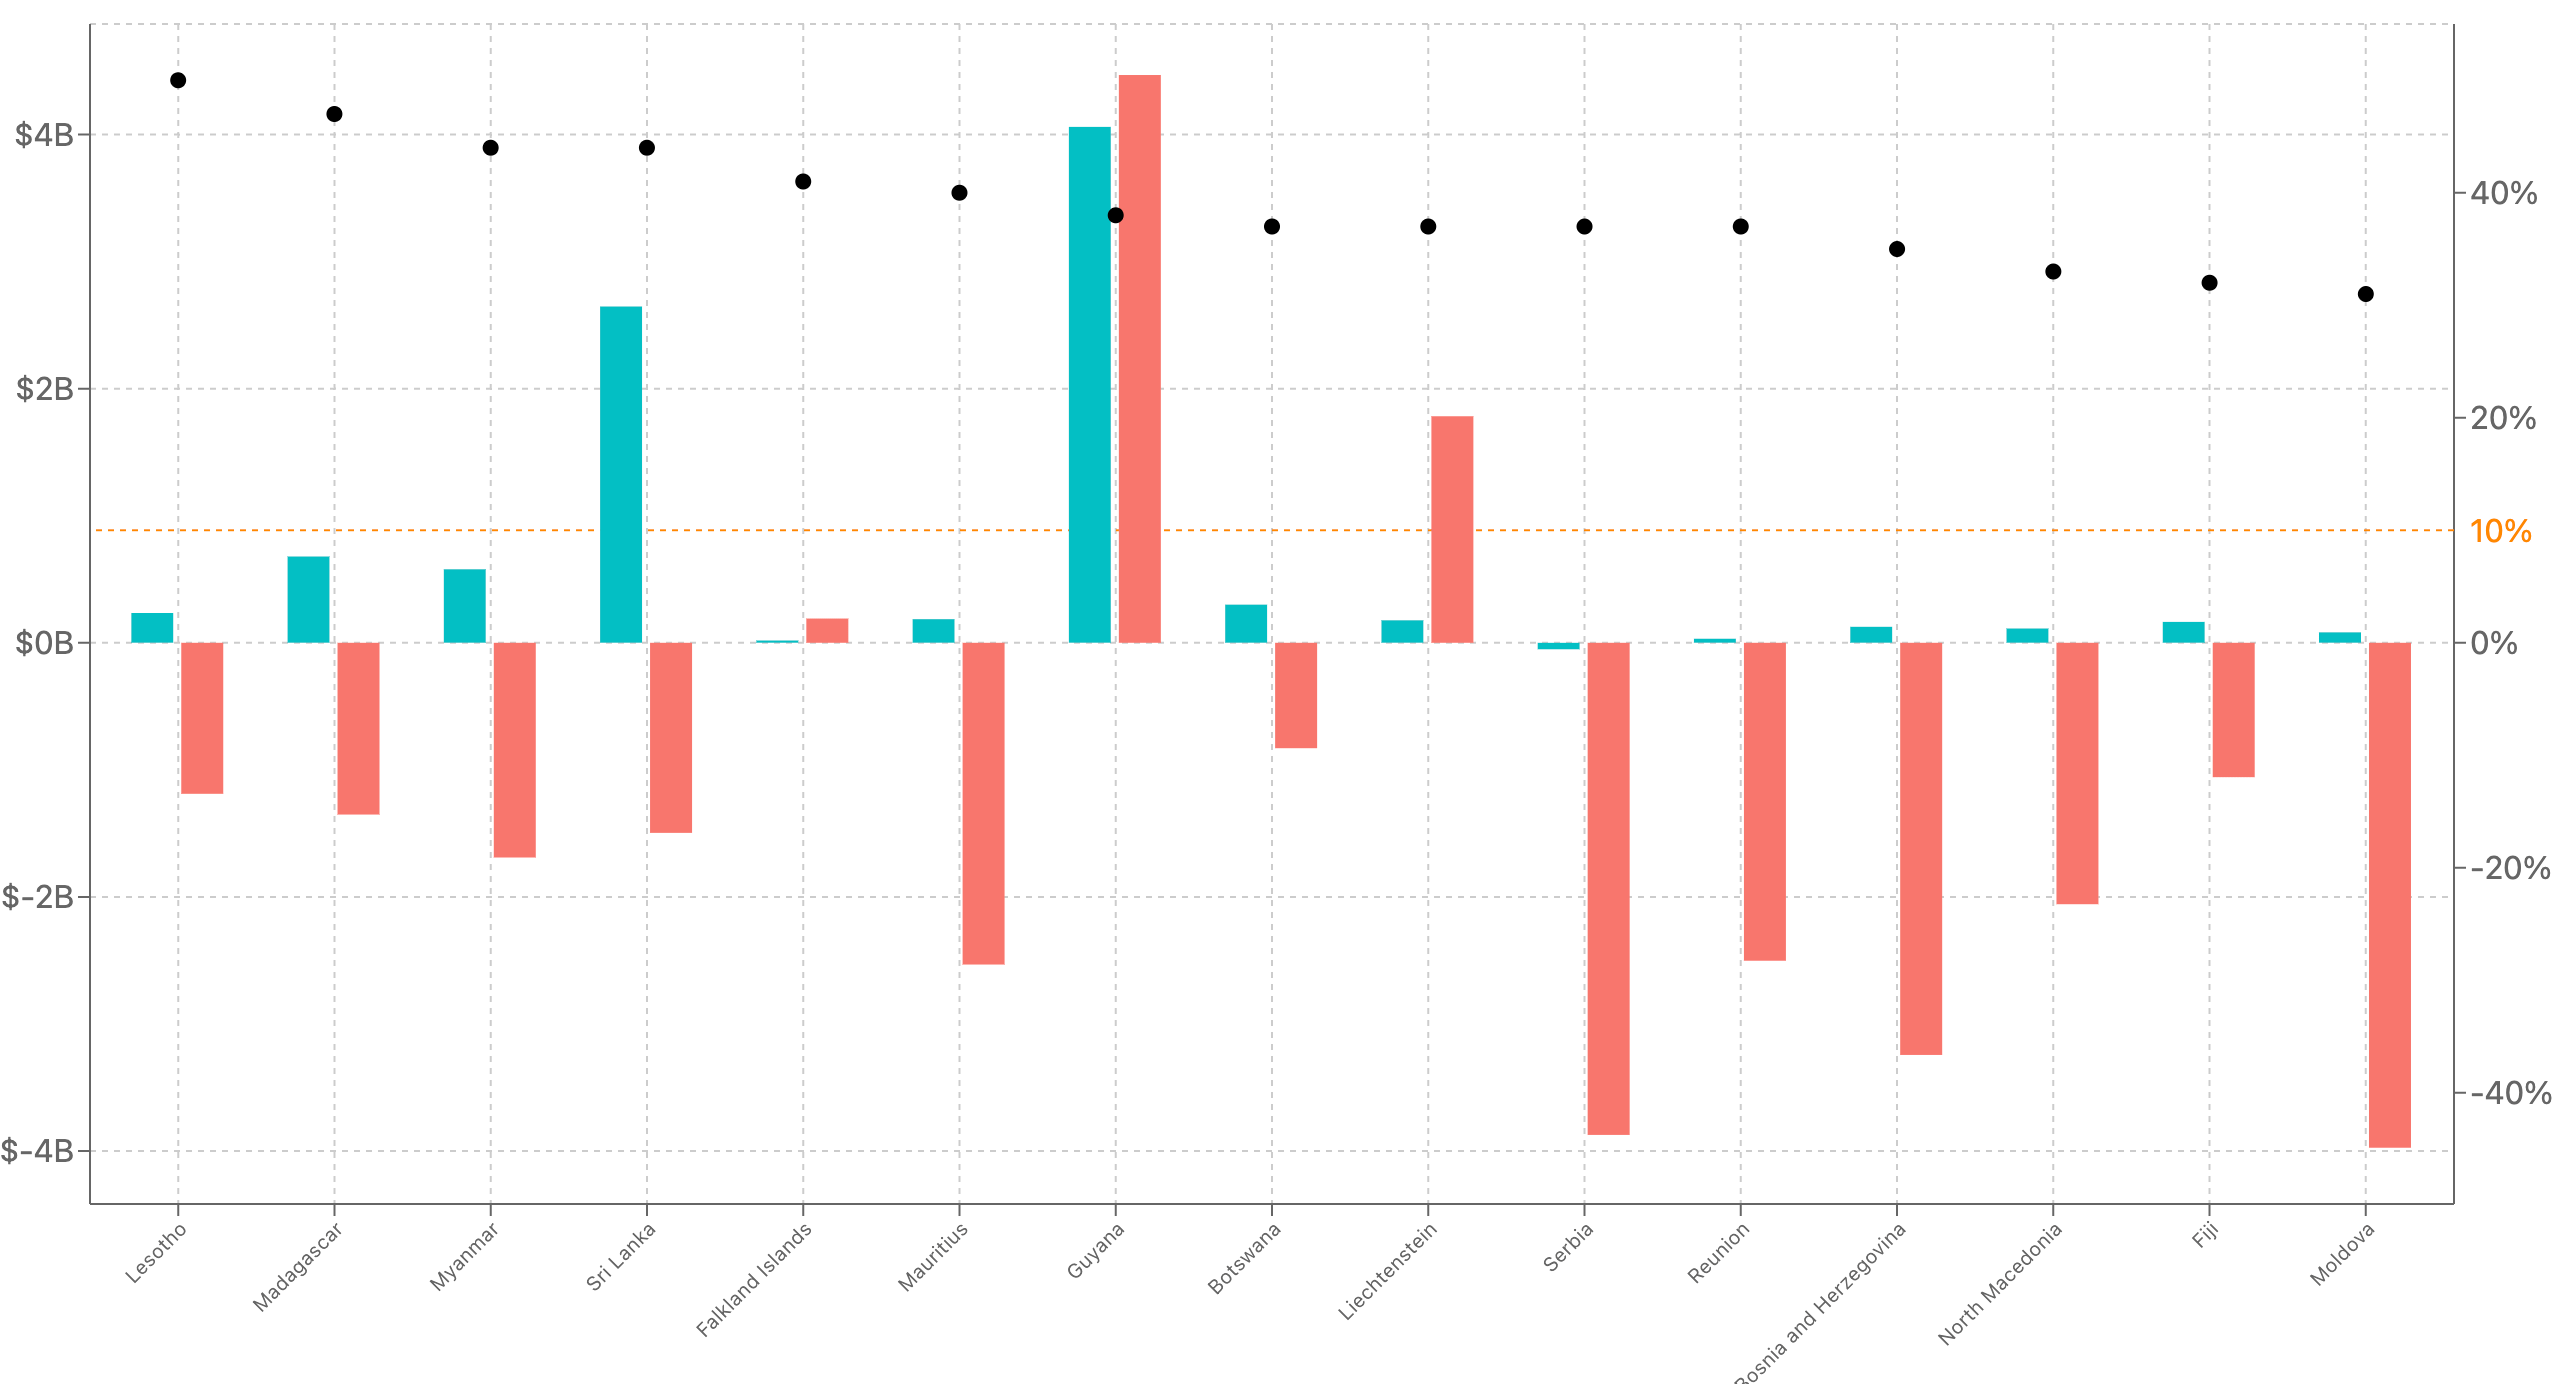
Another interesting result of the Trump administration's tariff formula is that it gives many countries — 28, to be exact — above baseline tariffs despite never being mentioned in the National Trade Estimate Report on Foreign Trade Barriers, filed less than a week before tariffs were rolled out. These 28 countries weren’t even members of groups called out in the NTE for anti-competitive practices, such as the Arab League or European Union. Jonathan Hillman, a senior fellow at the Council on Foreign Relations, points out that Mauritius, a small island nation residing in the Indian Ocean, was assigned a 40 percent tariff despite never being listed in the NTE and the U.S. Commerce Department listing no barriers to U.S. companies doing business in the country. See below, where every black dot represents the tariff rate of a country never mentioned in the NTE — with the orange line acting as a visual representation of the minimum tariff rate of 10 percent:
#2 — Anti-competitive behavior is not always followed by trade deficits, once again according to the Trump Admin's own trade report
Just like trade deficits are not always a result of anti-competitive behavior, anti-competitive behavior on behalf of a trading partner does not always necessitate a trade deficit on behalf of the U.S.
Of the 98 countries mentioned in the NTE report, which outlines nations with anti-competitive trade practices, 41 received only baseline tariffs or lower (excluding Mexico and Canada, who were subject to an earlier round of tariffs). This suggests that tariff calculations are not only mistakenly punitive toward countries without anti-competitive trade practices that happen to run surpluses with the U.S., but also fail to target countries with actual anti-competitive practices with which the U.S. runs surpluses. Even after discounting countries not directly named in the report but belonging to groups that were called out, 28 countries still received baseline or lower tariffs.

Brazil, for instance, received the baseline 10 percent tariff, despite being heavily mentioned in the NTE report for high tariffs and quotas:
"Brazil imposes relatively high tariffs on imports across a wide range of sectors, including automobiles, automotive parts, information technology and electronics, chemicals, plastics, industrial machinery, steel, and textiles and apparel. In addition, Brazil's bound rates are often much higher than its applied rates, and U.S. exporters face significant uncertainty in the Brazilian market because the government frequently modifies tariff rates within the flexibilities of MERCOSUR [a common market group, of which Brazil was a founding member]..." — 2025 National Trade Estimate Report on Foreign Trade Barriers, pg. 29
#3 — Trump's tariffs magnify minor absolute differences in trade balances — hurting smaller, developing economies
Of the 15 countries with the highest tariff levels, the median trade surplus is 680 million dollars, and no country besides Vietnam and Cambodia have a surplus greater than 10 billion dollars — a number which represents only one percent of the U.S. trade deficit. In fact, even if all of these countries eliminated their trade surpluses with the U.S., the deficit would only shrink by around 13 percent. Excluding Vietnam, this number drops to less than three percent. Most strikingly, Syria had a surplus of less than nine million dollars and was given the 8th highest tariff rate. See below the countries with the highest tariffs:
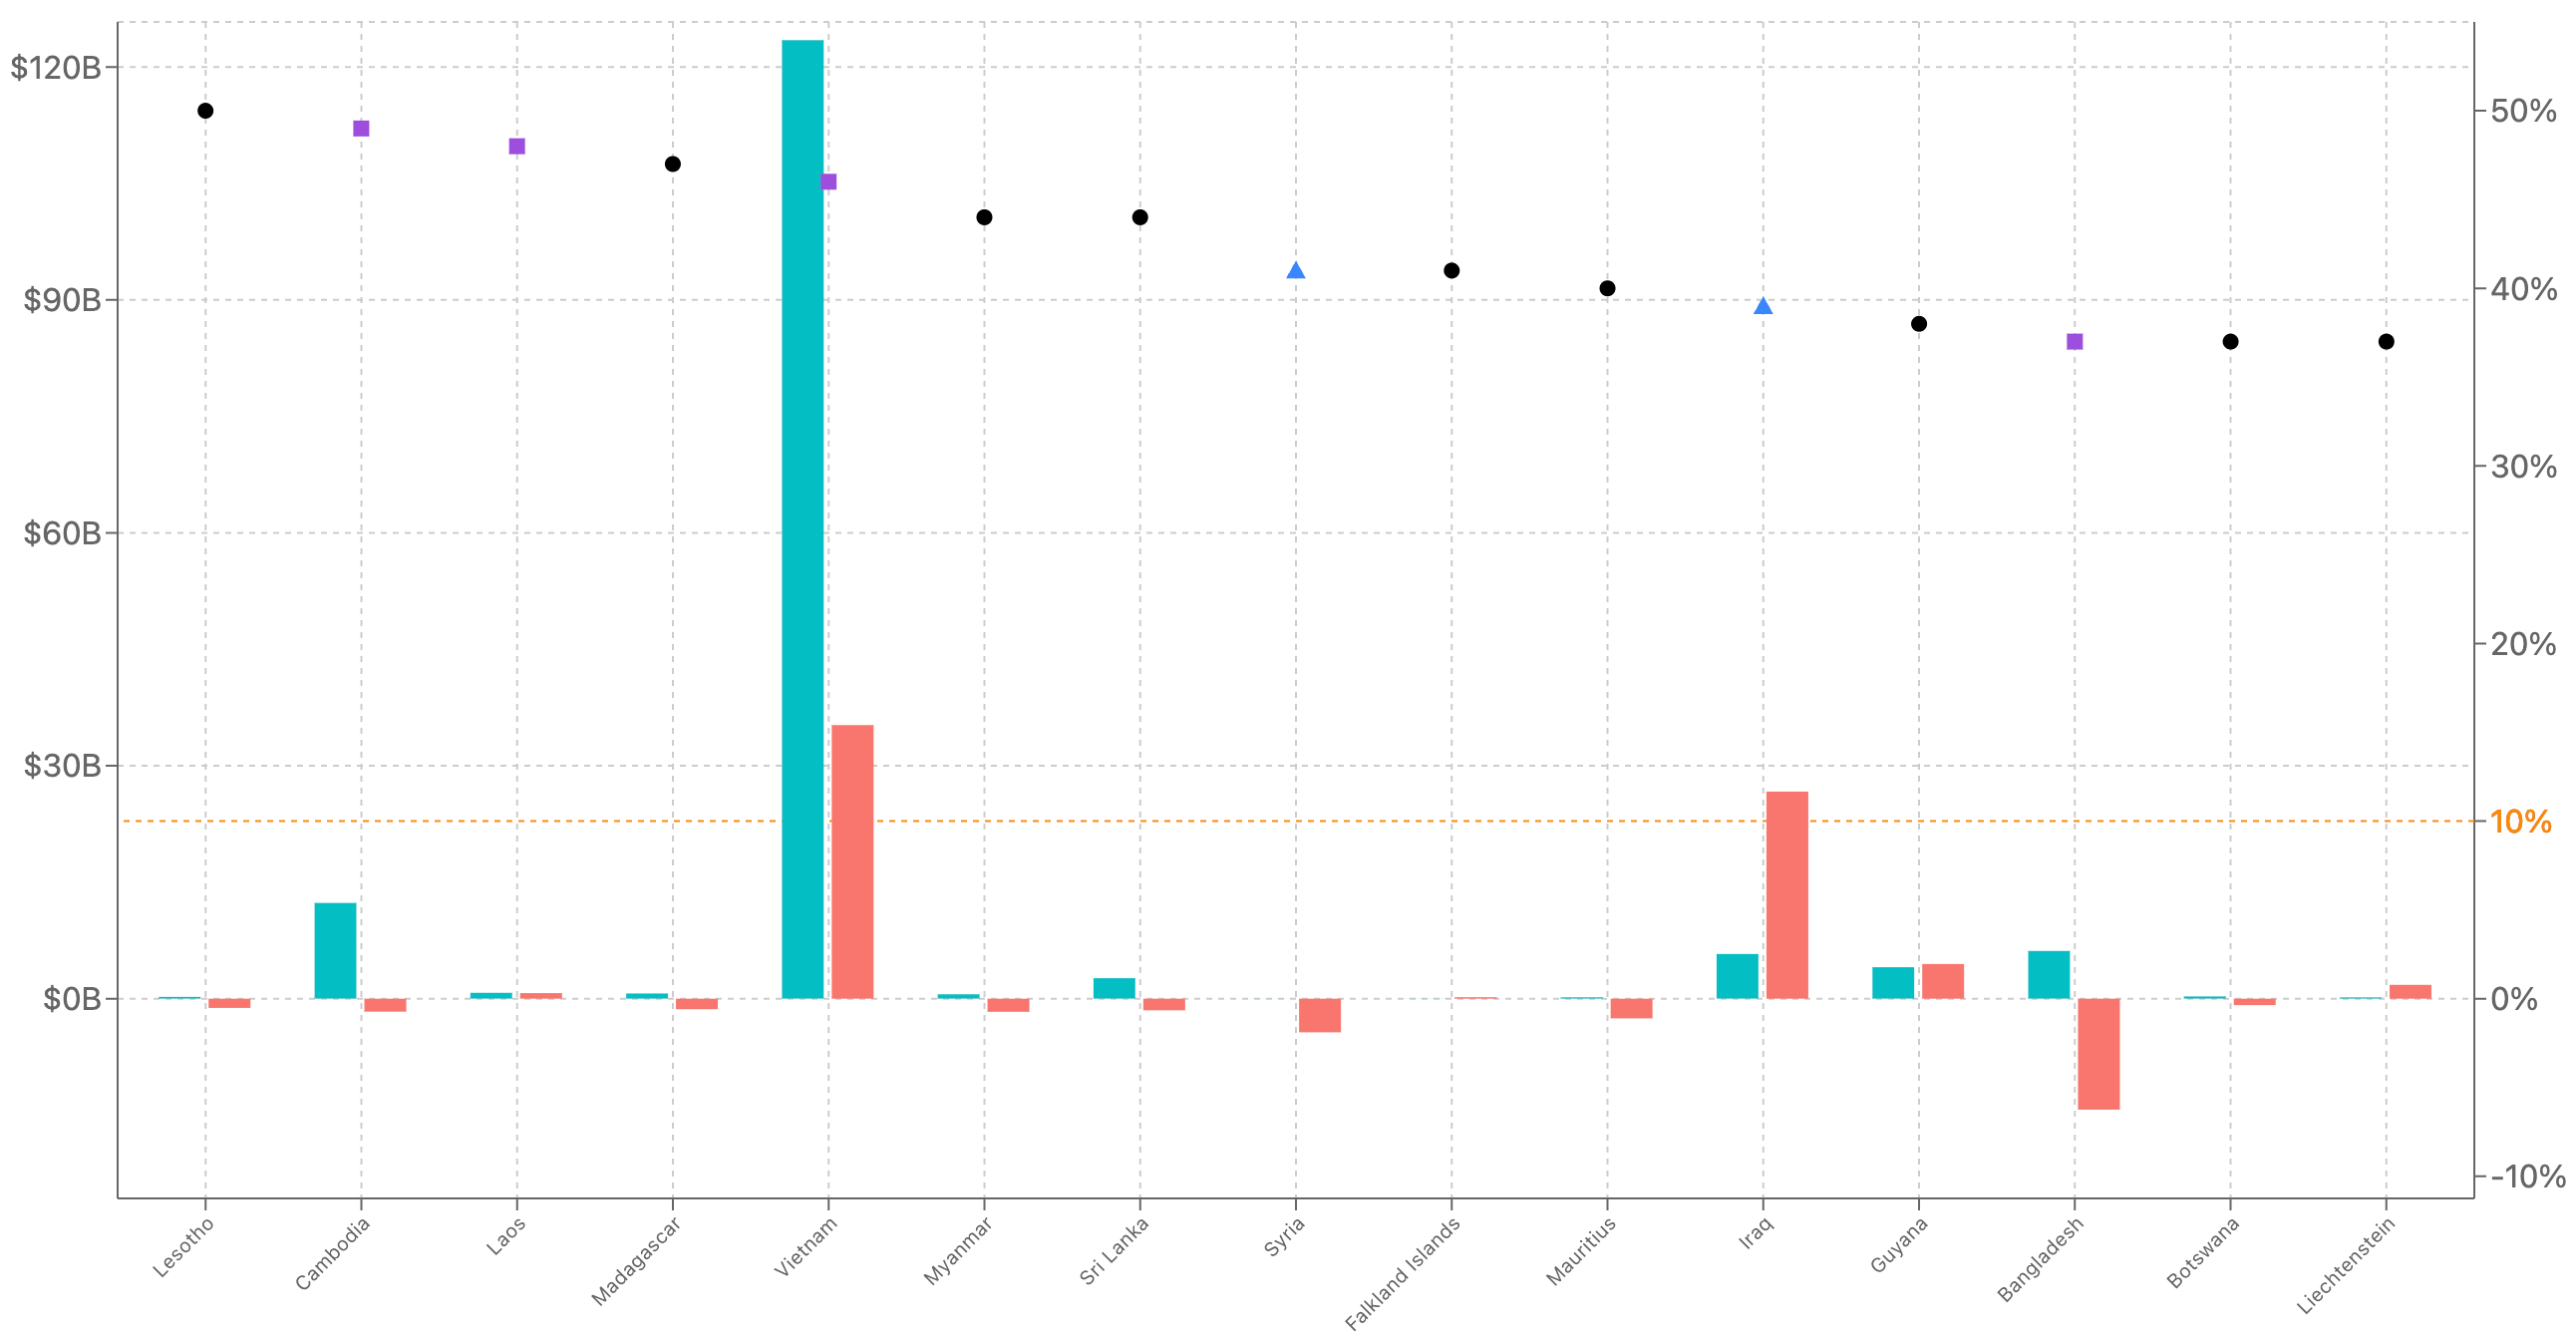
This is because the Trump administration's tariff policy is disproportionately punitive to smaller economies, since it magnifies small differences in trade balances. Since Syria does not export many goods to the U.S., but imports even fewer, the resulting trade surplus — though small in absolute terms — appears large in proportion, making Syria seem like a trade offender under a policy focused on balance rather than scale.
Though not immediately damaging to many of these countries since the value of their total exports to the U.S. is small, large tariffs may prevent the emergence of otherwise productive industry — especially in the case of developing countries — since they'd have to deal with prohibitively high tariffs with one of the largest export markets until the trade balance could be corrected, creating a circular trap: without access to the U.S. market, it becomes much more difficult to grow their export sectors, but without growing their export sectors, they can’t improve the trade balance to reduce tariffs and give them access to the U.S. market. This is especially damaging to a country like Syria, which is attempting to recover from over a decade of civil war.
Final Thoughts
Of course, it goes without saying — and certainly without a several page data visualization and analysis — that it probably isn’t a great idea to base an entire tariff regime on bilateral trade deficits. An introductory macroeconomics class could (and does!) tell you that.
What is most surprising about this data is…
The extent to which countries run bilateral surpluses with the U.S. but deficits globally. Exactly half of all countries with U.S. bilateral surpluses run deficits globally — many of whom are lower-income and smaller economically. Basing tariffs on bilateral trade balances alone therefore impacts the characteristics of the countries most likely to be tariffed. For this reason, Trump’s tariff regime is likely overly punitive on developing or smaller nations rather than countries with actual anti-competitive practices or states with real, substantive contributions to the size of the U.S. trade deficit.
The complete lack of consistency between the Trump administration’s NTE report on trade barriers with the April 2nd “reciprocal” tariff regime designed to punish countries found to be using these barriers.
The extent to which the Trump administration’s formula punishes smaller economies or countries with undeveloped U.S. trade relations because of minor differences in trade balance. This is most visible in the case of Syria but is also widely applicable among some of the most tariffed countries. Not to mention the implications on down-the-road development of the subsequent circular dilemma.
Lastly, and a bit tangential to the subject of the post, I found this quote from the Trump Administration’s official announcement of the reciprocal tariffs hilarious:
Countries including China, Germany, Japan, and South Korea have pursued policies that suppress the domestic consumption power of their own citizens to artificially boost the competitiveness of their export products. Such policies include regressive tax systems, low or unenforced penalties for environmental degradation, and policies intended to suppress worker wages relative to productivity. — The White House, April 2nd, 2025
If you want to check out the visualization yourself and play with the filters and sorting mechanisms, along with a host of other features, click here!